DDP Centennial: 100 years of Population Data
By Joshua Long, Data Program Director
The Downtown Detroit Partnership (DDP) is marking its 100-year anniversary this year. In 1922, the first version of the DDP was created as the Business Property Association and since then, DDP has gone through mergers, name changes and more. Over the last century, Detroit has seen one of the nation’s most radical swings in population change, which includes periods of both high growth and high decline. The story of Detroit’s growth and decline is well-known. By that time, Detroit was already in the middle of The Great Migration, prompted in large part by Henry Ford offering $5 a day for working in his factories. In 1910 Detroit had fewer than 500,000 people. By the 1925 census, Detroit had more than doubled to 1.24 million people.
Between 1925 and 1950, the city’s population had ballooned another 50% to 1.85 million. These were the boom times for Detroit. During World War II, Detroit’s manufacturing capacity grew to support the war effort. To support this effort, Detroit’s manufacturers attracted another wave of southerners and immigrants to good-paying factory jobs.
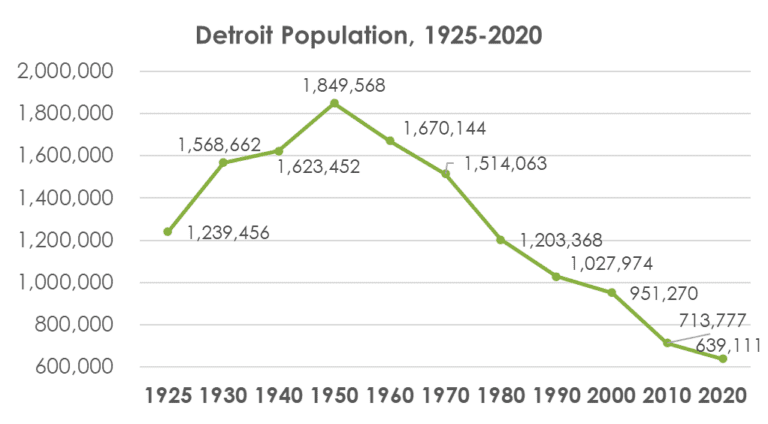
The 1950 census, however, marked the apex of population for the City, as people (especially whites and the more affluent) began to leave the City for the rapidly developing suburbs. Shedding hundreds of thousands of people a decade, by 2020, the City stood at about 640,000 people, near what it was in 1910.
But what about Downtown?
While the decline of Detroit is a well-known story, the Story of Downtown isn’t as well-known. Both DDP and Downtown have seen major changes in the past 100 years. DDP was first established to protest the 1922 increased assessed valuations and to encourage the building of a subway leading many miles out for future expansion. Downtown Detroit has also seen major changes, both physical and demographic. For instance, the population and population density of Downtown used to be much higher. Starting in 1950, a pattern of depopulation from the Downtown core clearly emerges.
This trend is clearly visible in the animated time-series map below.
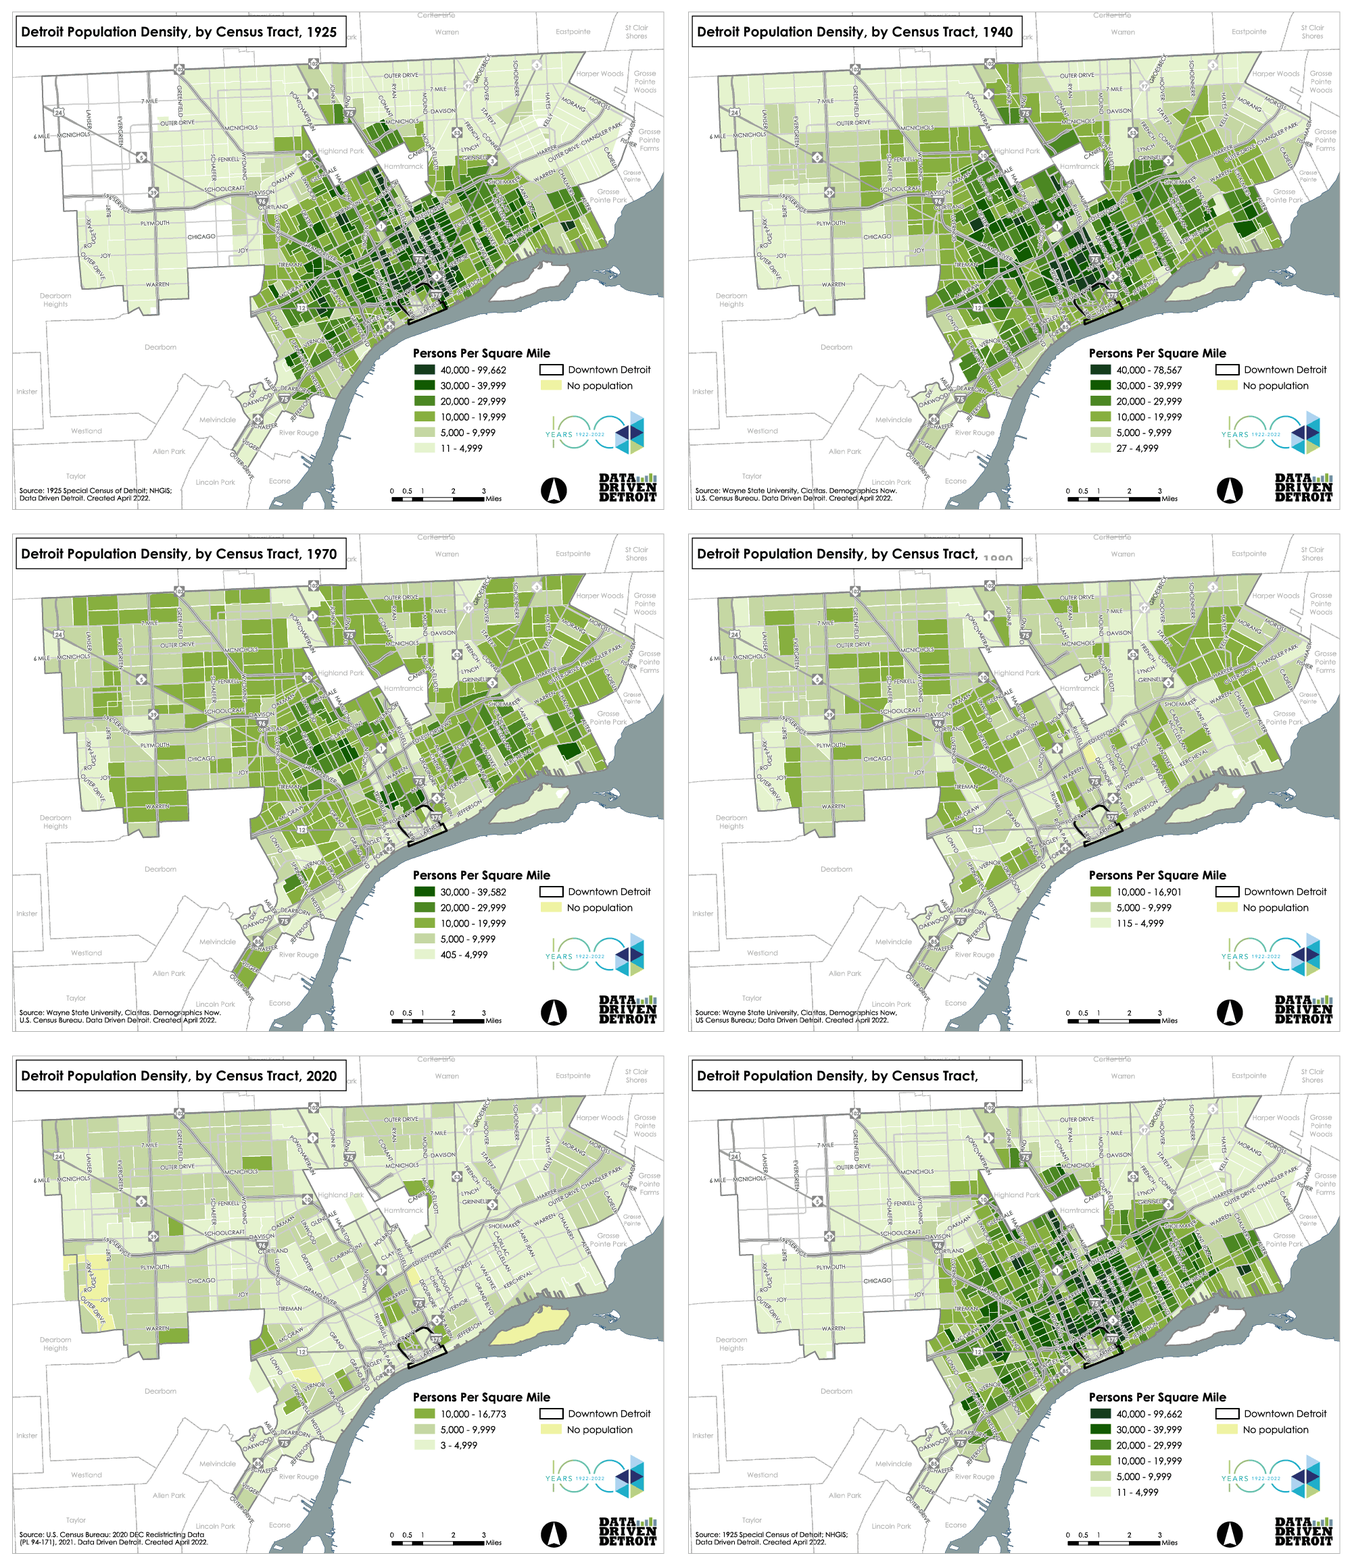
In 1950, the highest density tracts are clustered in and around Downtown and into Midtown. Then, as the decades pass, the density (represented by the darker greens) starts to spread to tracts further from Downtown as the City overall grows. Eventually, the densest areas in the city move further from the core. Near-Downtown neighborhoods like Brush Park, Woodbridge and the Cass Corridor, remained relatively dense into the 80’s before declining. Finally, the higher density categories go away all together as no tracts in the City remain at the density that they were in up until the 60s, and very few tracts contain even 10,000 people per sq mile.
Taking an in-depth look at Downtown population in particular, what stands out most is the population decline between 1950 and 1960. During this time, the Urban Renewal projects of the Chrysler Fwy and Lafayette Park were being constructed and they displaced over 100,000 people overall, mostly Southern Black migrants. Downtown they replaced the heavily populated “Black Bottom” and “Paradise Valley” neighborhoods.
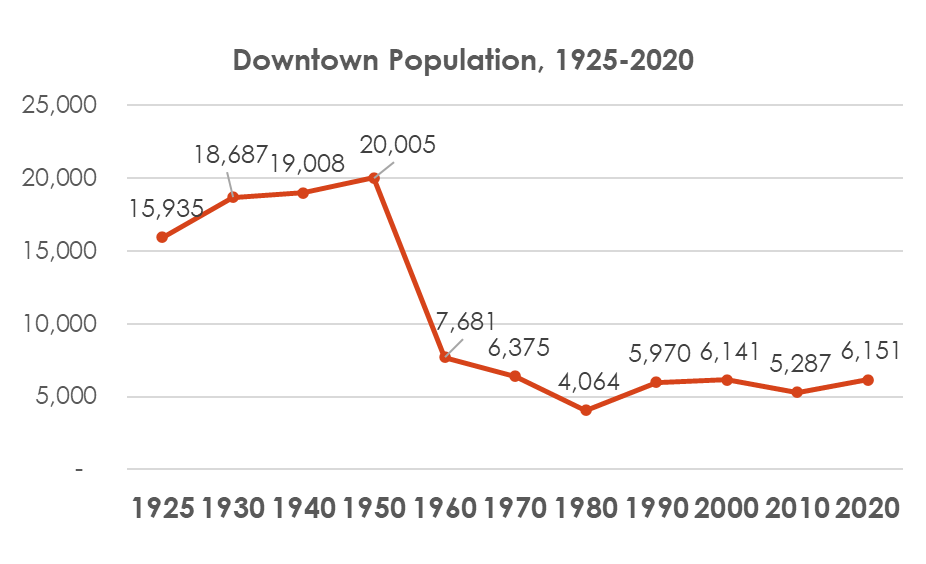
Because of this, population of Downtown was more than halved, from 20,005 to 7,681. This is especially remarkable since the city overall had not declined that much yet. To this day, these projects had a larger impact on Downtown than any other in the last century.
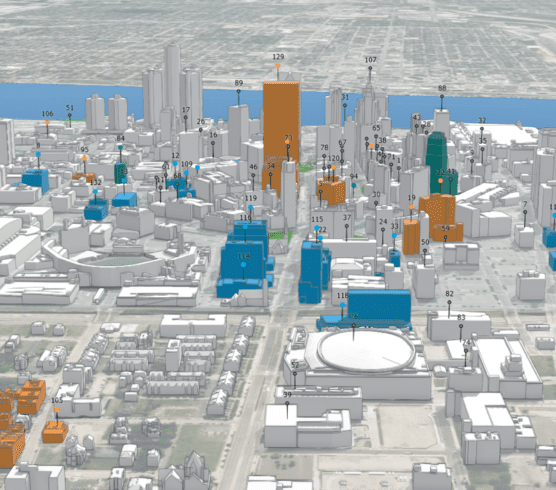
More recently, Downtown has been able to grow its population 16% in the past decade, despite the City overall losing population. A number of major residential building renovations and new construction projects have materialized in response to the demand for living in Downtown, vibrant areas. During the day, downtown is bustling with workers as the region’s employment hub, and at night Downtown is active with visitors coming for food and entertainment. Additional large residential projects, such as the Hudson’s site, the Joe Louis Arena site and the Book building (already under construction) and future developments such as the Monroe Block project will continue to increase the number of units Downtown. With these projects, plentiful job opportunities nearby, and a demand for entertainment, Downtown is on track to continue to grow through the next decade.
